Update (2016-03-30): The Creation and (Spoiler) Sale of 'Hood Rank
I tend to make a spreadsheet before purchasing anything over about $38 to make sure I'm getting the best product or at least the best value. So when we started thinking about spending four orders of magnitude more than that, I started compiling what ended up being a few of the most data and formula heavy spreadsheets I've ever made. Sound like fun? In the following, I elaborate on just how much fun.
I tend to make a spreadsheet before purchasing anything over about $38 to make sure I'm getting the best product or at least the best value. So when we started thinking about spending four orders of magnitude more than that, I started compiling what ended up being a few of the most data and formula heavy spreadsheets I've ever made. Sound like fun? In the following, I elaborate on just how much fun.
Global ("where to live.xls")
Long before
seriously considering buying a house, I had made a few spreadsheets that helped
me determine where to live. While travelling in 2009 and 2010 I wondered if any
of the places we visited in North America and Europe might be suitable places
to settle down. I rated a few things, such as the presence of various types of communities of which I would be interested
in being a part, the potential for a good job, the mountains, certain types
of weather, a low disaster risk, and 36 of my favourite friends and family
members, based on how important each metric was to me, and the percentage
chance that each existed (and would remain) in various cities. After visiting
the number of places I did, I was surprised to find
Edmonton to be such a front-runner on my personal world stage for places to
live, but this relatively quick spreadsheet helped illuminate why.
Local ("Neighbourhoods.xlsx")
After a few more
years living in Edmonton, my wife and I started looking at the odd house in the
area we were living at the time. I felt
that our choice of location might have been biased by the fact that we were already living there, so I started an in depth assessment of
Edmonton's 387 neighbourhoods. Thank you Edmonton
for all the data that is available in the City of Edmonton Open Data Catalogue! I
couldn't find everything I needed from there, but it was a great start, and
they even repaired one of the datasets for me that seemed somewhat broken (or at least less useful than it
could have been).
I ended up assigning
a 5 point rating for each of the following 9 requirements that were important
to our family for each of the 387 neighbourhoods in Edmonton:
- Schools
- Crime
- Location
- Grocery Store
- Transit
- Library
- River Valley Proximity
- Pool
- Spray Deck
- Playground (relatively unsuccessful, so I don’t count this one)
I then weighted each
priority with a number based on family discussions and summed all the weighted ratings
for each neighbourhood, resulting in a total number of points or a score, allowing me to compare it to all the other neighbourhoods (more on this below).
The school rating
was probably the most important, given our two young kids and plans for more. It was also the most complicated. I ran
into difficulty evaluating a large number of schools in any meaningful way. It seems that one would probably need to visit a
school and chat with some teachers to get a really good sense of its quality. So initially I settled on a formula that
provided a rating from 1 to 5 based on the total number of schools within 1
km of the neighbourhood centroid, the number of elementary schools within 1 km,
the number of junior high schools within 1.5 km, and the number of high schools
within 1.5 km. This would at least provide us with as much choice as possible. Once we
started looking at specific houses, I checked the Fraser Institute’s school ranking system (based
largely on grade 3 and 6 achievement tests) on the designated school for each house, but didn't give it too much weight in my decision.
Secondly, I compared crime rates between the neighbourhoods. Unfortunately it was
difficult to find an accurate crime related dataset in a useful format
(hopefully this is added to the Open Data Catalogue in the future), so I had to rely on the Edmonton Police Crime Mapping site. This site showed all the crimes in the last
three years for each neighbourhood, but unfortunately not in an easily
exportable format. I had to click
multiple times to access the information for each neighbourhood, then manually add and copy the total
crimes for the past three years (for 2011, 2012 and 2013). As such, I only ended up entering data for
about 130 neighbourhoods rather than the full 387, but these were the front-runners anyway. Initially, I scaled this data for each neighbourhood based on the total number of
crimes in all three years. For example,
to get 5 points, a neighbourhood would need to have had less than 100 crimes in
all of 2011, 2012 and 2013. Although
imperfect, at least it was something.
The biggest issue was that the neighbourhoods differed greatly in size
and population, so this wasn’t really a fair rating across all
neighbourhoods. It was surprisingly difficult to find
a dataset that provided neighbourhood size (without additional calculations), so I went with population. Population probably makes
more sense anyway because dividing the total number of crimes by population
would come closer to estimating the chance that a crime will be committed
against any one person (me, for example).
Next I added a location rating (above and beyond the various ratings based on proximity to important
things that I discuss below) to give extra points to neighbourhoods that are close to my work and
other places I tend to go often. I
settled on a centre point here because it seemed to be a pretty good average of all the
good stuff in Edmonton. A given neighbourhood
would get a rating of 5 if it was within 3.5 km of this centre point, 4 within
5 km, 3 points within 7 km, etc.. Even
with the location of each neighbourhood, it is surprisingly complicated to calculate
the distance between two coordinates. I
ended up with a formula that looked something like:
=6371*((2*ASIN(SQRT(((SIN(((RADIANS($U4)-RADIANS(W$1))/2))^2)+((COS(RADIANS($U4))*COS(RADIANS(W$1)))*(SIN(((RADIANS($V4)-RADIANS(W$2))/2))^2)))))))
Where W1
and W2 were the centre point coordinates and the latitude and longitude of the
neighbourhood centroids were in columns U and V. 6371 km is the radius of the Earth, which I
didn’t initially think I would need to buy a house. As it turned out, most of my ratings needed
this formula in some form or another.
Slightly
more complex than the location rating, my grocery story rating was based on the
distance to the nearest grocery store.
We really wanted to be able to quickly walk to the store to pick up any
last minute food items. As
such, the centroid of the neighbourhood had to be within 0.7 km of a grocery
store in order for the neighbourhood to get a rating of 5. The difficult part was compiling locations of
most grocery stores, especially since I needed the latitude and longitude. I had some success cleaning up the
source code from pages such as Save On Food’s Store Finder using a complicated procedure of finding and replacing. Some of the data was also available through point of interest databases for GPS services and devices. If neither of these options worked for a grocery chain (I’m looking at you Sobey’s), I was able to use a great tool called GPS Visualizer to convert a list of addresses into a list of location data.
A
neighbourhood's transit rating was primarily based on proximity to an LRT
station, and needed to be within 1 km to get a 5. If it didn’t already have a 5, a
neighbourhood would gain one extra point for being within 1 km of a transit
centre. I was previously able to find a dataset with all bus stop locations with type (apparently type is no longer listed as of this posting),
which I whittled down to just LRT stations and transit centres.
Converting this data to the 5 point system was relatively similar to the
above ratings.
Using
the City of Edmonton’s Open Data Catalogue again, the
proximity based ratings for libraries and spray parks were also relatively similar to the proximity ratings above.
Proximity
to the river valley was a slightly more difficult dataset to find, so I ended
up creating one. Using Google Maps Engine I created a line of coordinates throughout the river valley and sub-valleys such as
Whitemud Creek and Mill Creek. I
exported these as a KML file, then converted that to a CSV of location
coordinates to import into my spreadsheet.
In
addition to City of Edmonton pools I added the Meadows (which wasn’t on the city list yet), YMCAs, MacEwan U, U of A and NAIT pools to this dataset, then manually
added additional data for “indoor” and “toddler-friendly”. Neighbourhoods got higher rankings for being
close to both indoor and toddler-friendly pools due to our family’s apparent
tendency to be largely composed of toddlers.
For
playgrounds, I would have ideally liked a rating based on how good and fun a
playground is, but decided this wasn’t feasible without visiting each
playground and rating it manually (a project for another year). There are playgrounds all over the place, so instead
I aimed to rate neighbourhoods based on how many playgrounds were within a
certain distance of each neighbourhood.
Unfortunately, the City dataset appears to list each separate sand section within a playground as a
separate playground (among other problems) so I wasn’t able to calculate this rating. In
the end, I didn’t use a playground rating at all; instead, I made sure that the
playgrounds near the houses we looked at were pretty good.
After
compiling all of the above rankings for all of the neighbourhoods, I needed to
combine them into a total score for each neighbourhood. After some family discussion, I settled on
the following weightings for each rating:
Ranking
|
Weighting
|
Schools
|
6
|
Crime
|
5
|
Location
|
5
|
Grocery
Store
|
3
|
Transit
|
3
|
Library
|
1.5
|
River
Valley Proximity
|
1
|
Spray
Deck
|
1
|
Pool
|
0.5
|
Looking
at these after the fact, more discussion and thought might have led us to
change the bottom four, but I’m still happy with the top 5, which played a much
bigger role in the total score of a neighbourhood anyway. As you might expect, the formula for total
score then became:
Neighbourhood
Score = (schools ranking)*6 + (crime ranking)*5 + (location ranking)*5 + … +
(pool ranking)*0.5
Drumroll
please…after all that data and analysis, here are the top 96 neighbourhoods in Edmonton and their rankings!
| Ranking | Neighbourhood (NH) | Total Rating | Schools | Crime | Location | Grocery Store | Transit | Library | River Valley | Pool | Spray Deck |
| 1 | McKernan | 116 | 4 | 4 | 5 | 5 | 5 | 4 | 4 | 4 | 5 |
| 2 | Malmo Plains | 115 | 5 | 5 | 3 | 4 | 5 | 4 | 5 | 4 | 5 |
| 3 | Lendrum Place | 114 | 5 | 4 | 4 | 5 | 5 | 3 | 3 | 3 | 5 |
| 4 | Garneau | 114 | 4 | 3 | 5 | 5 | 5 | 5 | 5 | 5 | 5 |
| 5 | Royal Gardens | 113 | 5 | 4 | 3 | 5 | 5 | 4 | 5 | 4 | 5 |
| 6 | Greenfield | 109 | 5 | 5 | 3 | 5 | 3 | 3 | 4 | 3 | 5 |
| 7 | North Glenora | 105.5 | 5 | 3 | 4 | 5 | 2 | 5 | 5 | 4 | 5 |
| 8 | Rideau Park | 105.5 | 5 | 4 | 3 | 4 | 4 | 5 | 3 | 4 | 4 |
| 9 | Parkallen | 102 | 4 | 3 | 5 | 3 | 5 | 3 | 3 | 3 | 5 |
| 10 | Central McDougall | 101.5 | 5 | 0 | 5 | 5 | 5 | 4 | 3 | 5 | 5 |
| 11 | Fulton Place | 101.5 | 4 | 5 | 3 | 4 | 2 | 5 | 5 | 4 | 5 |
| 12 | Duggan | 101 | 5 | 4 | 3 | 4 | 3 | 5 | 2 | 3 | 4 |
| 13 | Holyrood | 100.5 | 5 | 4 | 4 | 3 | 1 | 5 | 4 | 4 | 5 |
| 14 | Strathcona | 100.5 | 5 | 1 | 5 | 4 | 3 | 5 | 5 | 4 | 5 |
| 15 | Downtown | 97.5 | 4 | 0 | 5 | 5 | 5 | 5 | 5 | 4 | 4 |
| 16 | Belgravia | 97.5 | 1 | 5 | 5 | 3 | 5 | 4 | 5 | 3 | 5 |
| 17 | Idylwylde | 96.5 | 5 | 2 | 4 | 5 | 1 | 5 | 4 | 4 | 5 |
| 18 | Ritchie | 96 | 4 | 2 | 5 | 4 | 2 | 5 | 5 | 3 | 5 |
| 19 | Pleasantview | 95.5 | 4 | 2 | 4 | 5 | 4 | 4 | 2 | 3 | 5 |
| 20 | Capilano | 95.5 | 3 | 5 | 3 | 5 | 2 | 3 | 5 | 4 | 5 |
| 21 | Parkview | 95 | 3 | 5 | 4 | 3 | 2 | 4 | 5 | 2 | 5 |
| 22 | Queen Alexandra | 94.5 | 4 | 0 | 5 | 5 | 4 | 5 | 4 | 4 | 5 |
| 23 | Ottewell | 93 | 5 | 2 | 4 | 4 | 1 | 5 | 4 | 3 | 5 |
| 24 | Glenora | 92 | 4 | 4 | 4 | 3 | 1 | 3 | 5 | 3 | 5 |
| 25 | King Edward Park | 91.5 | 4 | 2 | 4 | 5 | 1 | 5 | 5 | 4 | 5 |
| 26 | Meadowlark Park | 91.5 | 5 | 2 | 3 | 5 | 1 | 5 | 4 | 4 | 5 |
| 27 | Rossdale | 91.5 | 0 | 4 | 5 | 4 | 5 | 5 | 5 | 4 | 5 |
| 28 | Windsor Park | 91.5 | 0 | 5 | 5 | 3 | 5 | 5 | 5 | 4 | 3 |
| 29 | Elmwood | 91 | 3 | 5 | 3 | 4 | 1 | 4 | 5 | 4 | 5 |
| 30 | Empire Park | 90 | 5 | 0 | 3 | 5 | 5 | 5 | 2 | 3 | 4 |
| 31 | Bonnie Doon | 88.5 | 4 | 1 | 5 | 3 | 2 | 5 | 5 | 4 | 5 |
| 32 | Blue Quill | 88.5 | 3 | 4 | 2 | 4 | 5 | 2 | 5 | 3 | 4 |
| 33 | Crestwood | 88.5 | 3 | 4 | 4 | 4 | 1 | 3 | 5 | 2 | 5 |
| 34 | Carter Crest | 88 | 4 | 5 | 2 | 4 | 0 | 5 | 5 | 5 | 2 |
| 35 | Aspen Gardens | 87.5 | 3 | 5 | 3 | 3 | 2 | 2 | 5 | 3 | 5 |
| 36 | West Meadowlark Park | 85.5 | 5 | 2 | 3 | 4 | 0 | 5 | 4 | 4 | 5 |
| 37 | McCauley | 85 | 3 | 0 | 5 | 3 | 5 | 4 | 5 | 4 | 5 |
| 38 | Jasper Park | 85 | 5 | 0 | 3 | 5 | 2 | 5 | 5 | 3 | 5 |
| 39 | Lynnwood | 85 | 3 | 3 | 3 | 5 | 1 | 5 | 5 | 3 | 5 |
| 40 | Allendale | 85 | 4 | 1 | 5 | 3 | 3 | 3 | 2 | 3 | 5 |
| 41 | Leger | 85 | 4 | 5 | 1 | 4 | 1 | 5 | 4 | 5 | 2 |
| 42 | Spruce Avenue | 84.5 | 4 | 0 | 4 | 4 | 4 | 5 | 2 | 4 | 5 |
| 43 | Riverdale | 84.5 | 1 | 3 | 5 | 3 | 4 | 4 | 5 | 3 | 5 |
| 44 | Sweet Grass | 84 | 3 | 4 | 2 | 3 | 4 | 3 | 4 | 3 | 5 |
| 45 | Laurier Heights | 83 | 1 | 5 | 4 | 3 | 2 | 4 | 5 | 2 | 5 |
| 46 | Woodcroft | 82.5 | 5 | 1 | 3 | 4 | 1 | 5 | 3 | 4 | 5 |
| 47 | Northmount | 82.5 | 5 | 2 | 2 | 5 | 2 | 3 | 0 | 4 | 5 |
| 48 | Grovenor | 82 | 4 | 2 | 4 | 4 | 0 | 3 | 5 | 3 | 5 |
| 49 | Belmont | 82 | 3 | 4 | 1 | 5 | 4 | 2 | 4 | 4 | 3 |
| 50 | Gold Bar | 82 | 1 | 5 | 3 | 5 | 1 | 4 | 5 | 4 | 5 |
| 51 | Forest Heights | 82 | 4 | 2 | 4 | 2 | 2 | 3 | 5 | 3 | 5 |
| 52 | Patricia Heights | 82 | 3 | 5 | 3 | 3 | 0 | 3 | 5 | 3 | 4 |
| 53 | Meyonohk | 81.5 | 3 | 5 | 2 | 3 | 2 | 4 | 1 | 5 | 4 |
| 54 | Ramsay Heights | 80.5 | 3 | 5 | 2 | 3 | 1 | 4 | 5 | 3 | 3 |
| 55 | Sherwood | 80 | 5 | 1 | 3 | 3 | 1 | 5 | 5 | 3 | 4 |
| 56 | Oliver | 80 | 0 | 2 | 5 | 5 | 4 | 4 | 5 | 4 | 5 |
| 57 | Terwillegar Towne | 80 | 4 | 5 | 1 | 4 | 1 | 3 | 3 | 5 | 1 |
| 58 | Glenwood | 79.5 | 5 | 1 | 3 | 4 | 1 | 4 | 3 | 3 | 4 |
| 59 | Delwood | 79.5 | 4 | 2 | 2 | 4 | 3 | 5 | 0 | 4 | 5 |
| 60 | Steinhauer | 79.5 | 1 | 5 | 2 | 4 | 4 | 4 | 3 | 3 | 4 |
| 61 | Eastwood | 79 | 3 | 0 | 3 | 5 | 5 | 4 | 3 | 4 | 5 |
| 62 | Thorncliff | 79 | 3 | 3 | 2 | 5 | 1 | 4 | 5 | 4 | 5 |
| 63 | Kenilworth | 78 | 3 | 3 | 4 | 4 | 0 | 3 | 2 | 3 | 5 |
| 64 | Avonmore | 78 | 3 | 3 | 4 | 3 | 0 | 3 | 5 | 3 | 5 |
| 65 | Boyle Street | 77.5 | 1 | 0 | 5 | 4 | 5 | 5 | 5 | 4 | 5 |
| 66 | Lee Ridge | 77 | 5 | 3 | 2 | 3 | 0 | 4 | 1 | 4 | 4 |
| 67 | Bellevue | 76.5 | 3 | 0 | 3 | 3 | 5 | 5 | 5 | 4 | 5 |
| 68 | Alberta Avenue | 76 | 3 | 0 | 4 | 3 | 4 | 5 | 3 | 3 | 5 |
| 69 | Inglewood | 76 | 4 | 0 | 4 | 4 | 1 | 5 | 3 | 3 | 5 |
| 70 | McQueen | 75 | 4 | 2 | 3 | 3 | 0 | 4 | 4 | 4 | 5 |
| 71 | Highlands | 75 | 3 | 1 | 3 | 3 | 3 | 5 | 5 | 3 | 5 |
| 72 | Cloverdale | 75 | 0 | 2 | 5 | 3 | 4 | 5 | 5 | 3 | 5 |
| 73 | Killarney | 74.5 | 5 | 0 | 3 | 4 | 2 | 2 | 1 | 5 | 5 |
| 74 | Virginia Park | 74.5 | 1 | 2 | 3 | 4 | 4 | 5 | 5 | 4 | 5 |
| 75 | Grandview Heights | 74.5 | 0 | 5 | 4 | 2 | 4 | 1 | 5 | 2 | 4 |
| 76 | Cromdale | 74 | 1 | 0 | 4 | 5 | 5 | 4 | 5 | 4 | 5 |
| 77 | York | 73.5 | 3 | 2 | 1 | 5 | 4 | 5 | 1 | 4 | 3 |
| 78 | Sifton Park | 73.5 | 3 | 2 | 1 | 5 | 5 | 2 | 2 | 5 | 3 |
| 79 | Hazeldean | 73.5 | 1 | 3 | 5 | 3 | 1 | 3 | 5 | 2 | 5 |
| 80 | Glengarry | 73 | 5 | 0 | 2 | 5 | 2 | 3 | 0 | 5 | 5 |
| 81 | Kameyosek | 73 | 3 | 3 | 2 | 4 | 1 | 5 | 0 | 5 | 5 |
| 82 | Carlisle | 73 | 3 | 4 | 2 | 4 | 0 | 4 | 0 | 4 | 5 |
| 83 | Lansdowne | 72.5 | 0 | 5 | 3 | 3 | 3 | 2 | 5 | 3 | 5 |
| 84 | Montrose | 71.5 | 3 | 0 | 3 | 3 | 4 | 5 | 3 | 4 | 5 |
| 85 | Bergman | 71.5 | 3 | 2 | 2 | 3 | 3 | 4 | 3 | 3 | 5 |
| 86 | Blue Quill Estates | 71.5 | 1 | 5 | 2 | 3 | 3 | 2 | 5 | 3 | 3 |
| 87 | Tawa | 71.5 | 4 | 2 | 1 | 5 | 1 | 5 | 0 | 4 | 5 |
| 88 | Canora | 71 | 4 | 0 | 3 | 5 | 1 | 2 | 5 | 2 | 5 |
| 89 | Strathearn | 71 | 0 | 3 | 5 | 2 | 2 | 5 | 5 | 3 | 5 |
| 90 | Meyokumin | 70.5 | 3 | 3 | 1 | 5 | 1 | 5 | 0 | 4 | 5 |
| 91 | Rundle Heights | 70 | 3 | 1 | 2 | 4 | 2 | 5 | 5 | 5 | 4 |
| 92 | Tipaskan | 70 | 3 | 3 | 2 | 3 | 2 | 4 | 0 | 4 | 4 |
| 93 | McLeod | 70 | 3 | 3 | 1 | 3 | 3 | 5 | 0 | 5 | 4 |
| 94 | Ekota | 70 | 3 | 4 | 1 | 4 | 0 | 5 | 0 | 5 | 5 |
| 95 | Callingwood North | 70 | 3 | 2 | 2 | 4 | 0 | 5 | 5 | 5 | 5 |
| 96 | Parkdale | 69.5 | 0 | 0 | 4 | 5 | 5 | 5 | 5 | 4 | 5 |
Neighbourhood
After reading the
paragraph above about grocery stores, you were probably thinking, “0.7 km to
the closest grocery store? But the neighbourhood
itself is probably bigger than that!” I
too was worried, so I realized it was important to get a view of how much a neighbourhood rating could vary within any given neighbourhood. In order to take a look within a specific
neighbourhood, I converted the rows of my spreadsheet from the 387 or so
neighbourhoods to a series of locations (latitude and longitude sets). I was then able to import the scores for each
of these locations (differing by less than 100 m) into a cool mapping tool
called Open Heat Map to create the following
maps.


I also used the City of Edmonton Neighbourhood Maps to take a look at the top neighbourhoods
based on total points (ignore the fact that Royal Gardens is red):

Additionally, with
some data graciously provided by Mike Ross I was able to add average house price and points/$10 000 to my
spreadsheet. Here are the neighbourhoods
with the highest points per dollar:

Houses ("Houses.xls")
These maps and data,
among other things, led my wife and me to focus our search primarily in Malmo, Royal
Gardens and the surrounding areas, which of course necessitated the development
of another spreadsheet. This spreadsheet
incorporated the “Neighbourhoods.xls” spreadsheet in its entirety (see above),
but used the location of each house to calculate the location related rating instead of the location of the
neighbourhood. It also included an entire
additional section for house specific statistics such as total surface area,
number of bedrooms, yard size, and number of bathrooms. For each house we viewed or that looked
interesting, I calculated location points (similar to the neighbourhood points
described above), house points (using house related ratings), total points, and total points per dollar based on asking price.
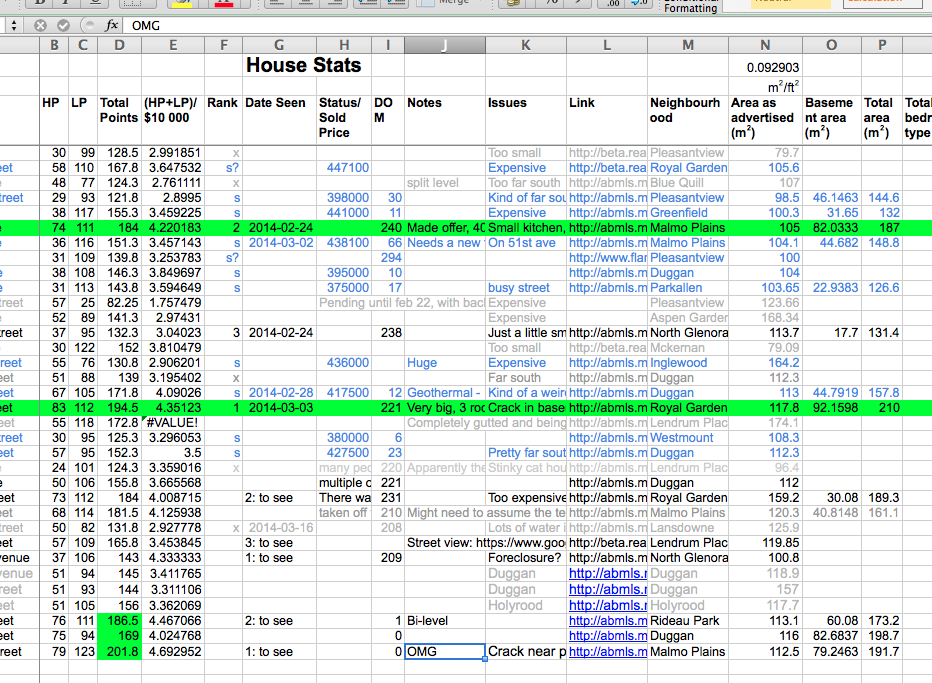
This spreadsheet
also allowed me to track and take notes on houses we visited, and started to
give me a view into market data by tracking the price at which houses sold and
the number of days they were on the market (inspiring me to create the next
spreadsheet).
I hadn’t initially
intended to create a spreadsheet relating to market data; I really only wanted
to learn a little bit about why people say things
like “oh, now is a good time to buy…better hurry”. I
came across a few books about buying houses and managed to get through “Realty Check: Real Estate Secrets for First Time Canadian Home Buyers" by Sandra Rinomato, “Welcome Home: Insider Secrets for Buying or Selling your Property” by Sarah Daniels, and most interestingly, “Secrets of the Canadian Real Estate Cycle” by Don Campbell and others.
“Secrets of the Canadian Real Estate Cycle” gave me great insight into
some of the variables that actually determine house prices in a given area, and
even provided examples. Unfortunately, these examples were often from Calgary, Vancouver or Toronto, which kept
leading me to wonder, “what is the real estate cycle like in Edmonton?” I
would advise you to read or at least skim Don Campbell’s book in order for the rest of this section to make an optimal amount of sense. The gist is that there are 16 or so key drivers that provide clues as to in what stage of the real estate cycle a given area is: recovery, boom or slump. With good data going back in time for years, combining these drivers in an unbiased, scientific way can really help inform your real estate investment decisions.
So I
started poking around to see if I could find some of the data that Don Campbell
was talking about, but specific to Edmonton.
It was not in the least bit easy, but here’s what I found*:


*Much
of the data has been averaged over each month or year to reduce noise. For the Statistics Canada links, you will
need to "Add/Remove" and "Manipulate" data using their form to find what I used.
Using Don’s method
as best as I could, I came to the following conclusions about each of the key
drivers of the real estate cycle in Edmonton in early 2014:


As a result, I inferred that we were at the end of the recovery phase and heading for a boom. My family and I were probably going to buy a
house anyway, so this didn’t really affect our decision, but it was very
interesting and kind of fun. If anyone
knows more about this technique, please let me know how close I was in my
assessment, or if I made any significant mistakes!
Success!
Finally it came time
to buy the best house in the best place in the best neighbourhood in the best
city in the world (for us); but could we afford it? Obviously I had been working to gain a better
understanding of mortgages long before this final stage, but the detailed
mortgage spreadsheet I created really came in handy during our multiple offer bidding and negotiating
situation. I found the vast
majority of online mortgage calculators to not provide enough information about
how mortgages really work, often due to a bias towards the bank offering the
calculator. Plus, creating one myself gave me a deeper understanding and more confidence on how much more we could really afford to offer.
In addition to
countless other financial spreadsheets, decision assistance spreadsheets and
even an analysis of the cost of covering our house with bubble wrap, my efforts
certainly seem to have paid off! We
moved into our new house in May and so far the experimental data has confirmed the above excel-based theoretical analysis that we are living in the best 586 m2
in the world** and we got a sweet deal on it!
**to live in, given our current priorities, life situation, and savings.
This. Is. Amazing.
ReplyDeleteThanks Tyson!
Deleteyou forgot to include mosquito trap data ;)
ReplyDeleteGood suggestion! How much does it vary throughout the city, and is it consistent from year to year?
DeleteYou are just like your aunt only worse! I love it.
ReplyDelete:) Thanks!
DeleteThis comment has been removed by a blog administrator.
ReplyDeleteThis comment has been removed by a blog administrator.
ReplyDeleteThis comment has been removed by a blog administrator.
ReplyDeleteThis comment has been removed by a blog administrator.
ReplyDeleteThis comment has been removed by a blog administrator.
ReplyDeleteThis comment has been removed by a blog administrator.
ReplyDelete